![]()
Communication through Infographics.
Data visualizations generate interest and understanding among users.
Advantages of Infographics.
Understanding how things fit together can be challenging, especially with the flood of information we encounter daily. At Informotional, we specialize in creating visual contexts that help our clients and their audience grasp the connections between data, numbers, and facts.
Our infographics and info-illustrations can be used as standalone communication tools or to support text. We also offer animated versions in moving image media. Contact us for expert advice and assistance.


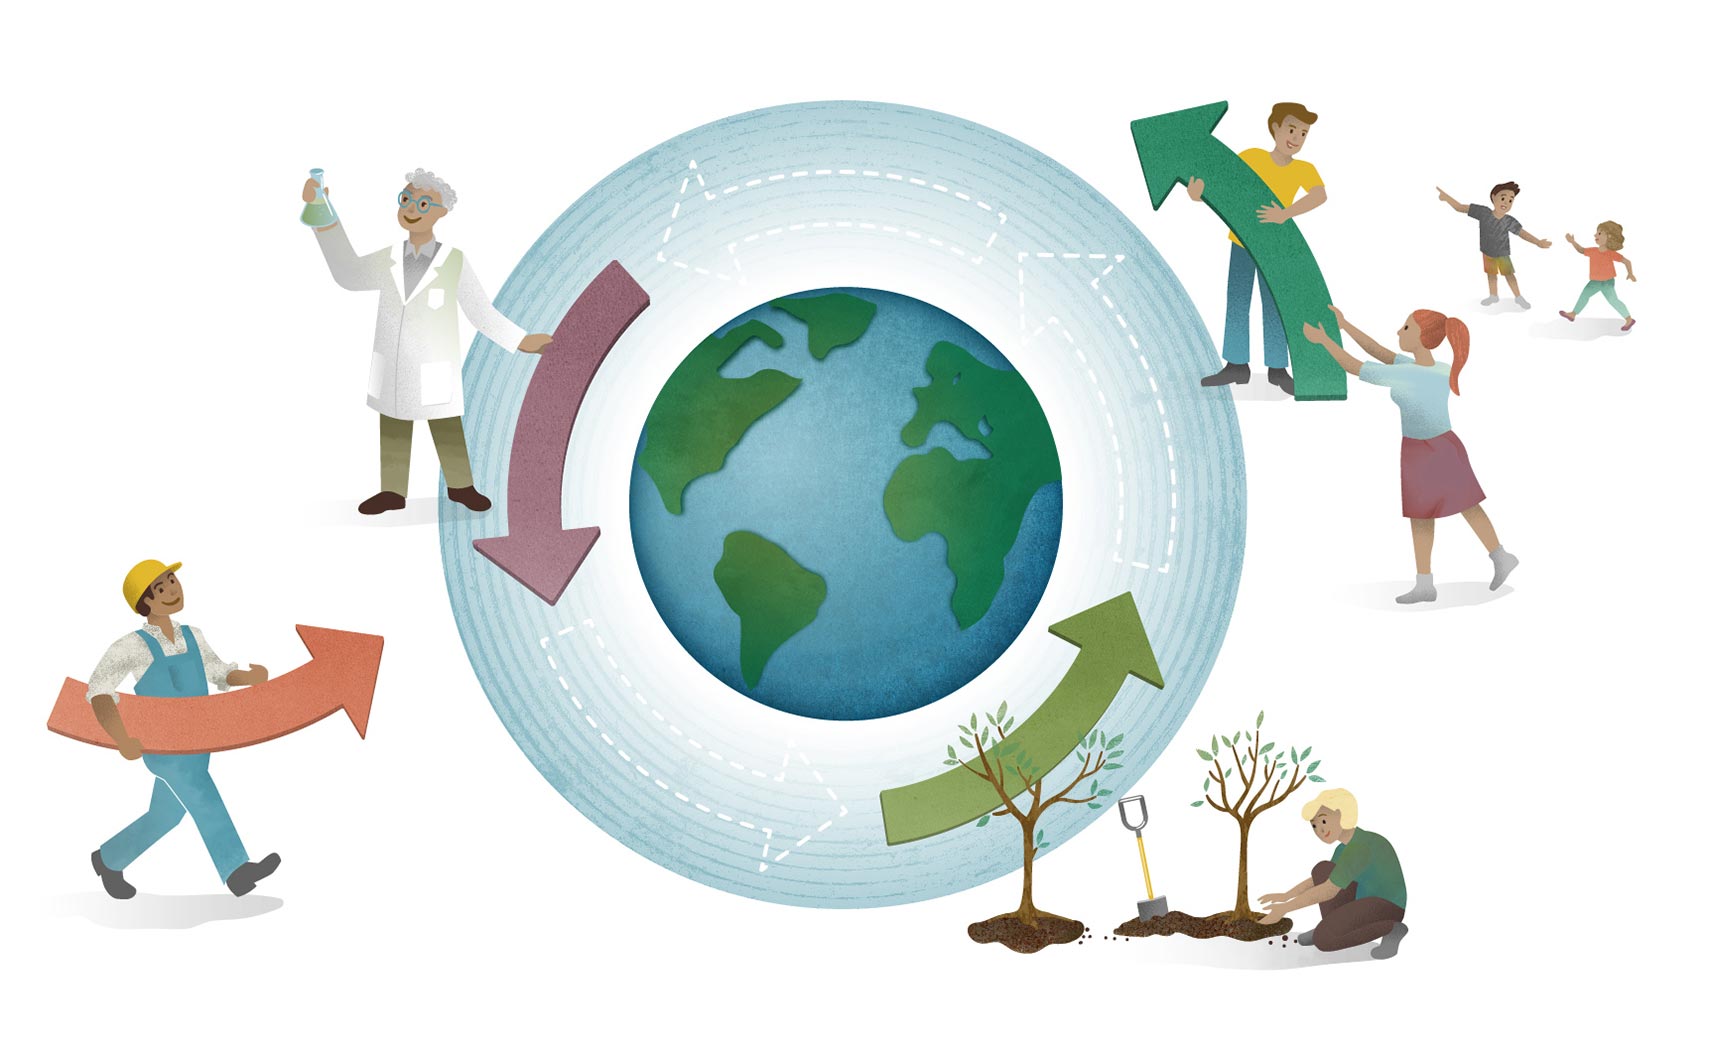
Scientists for future
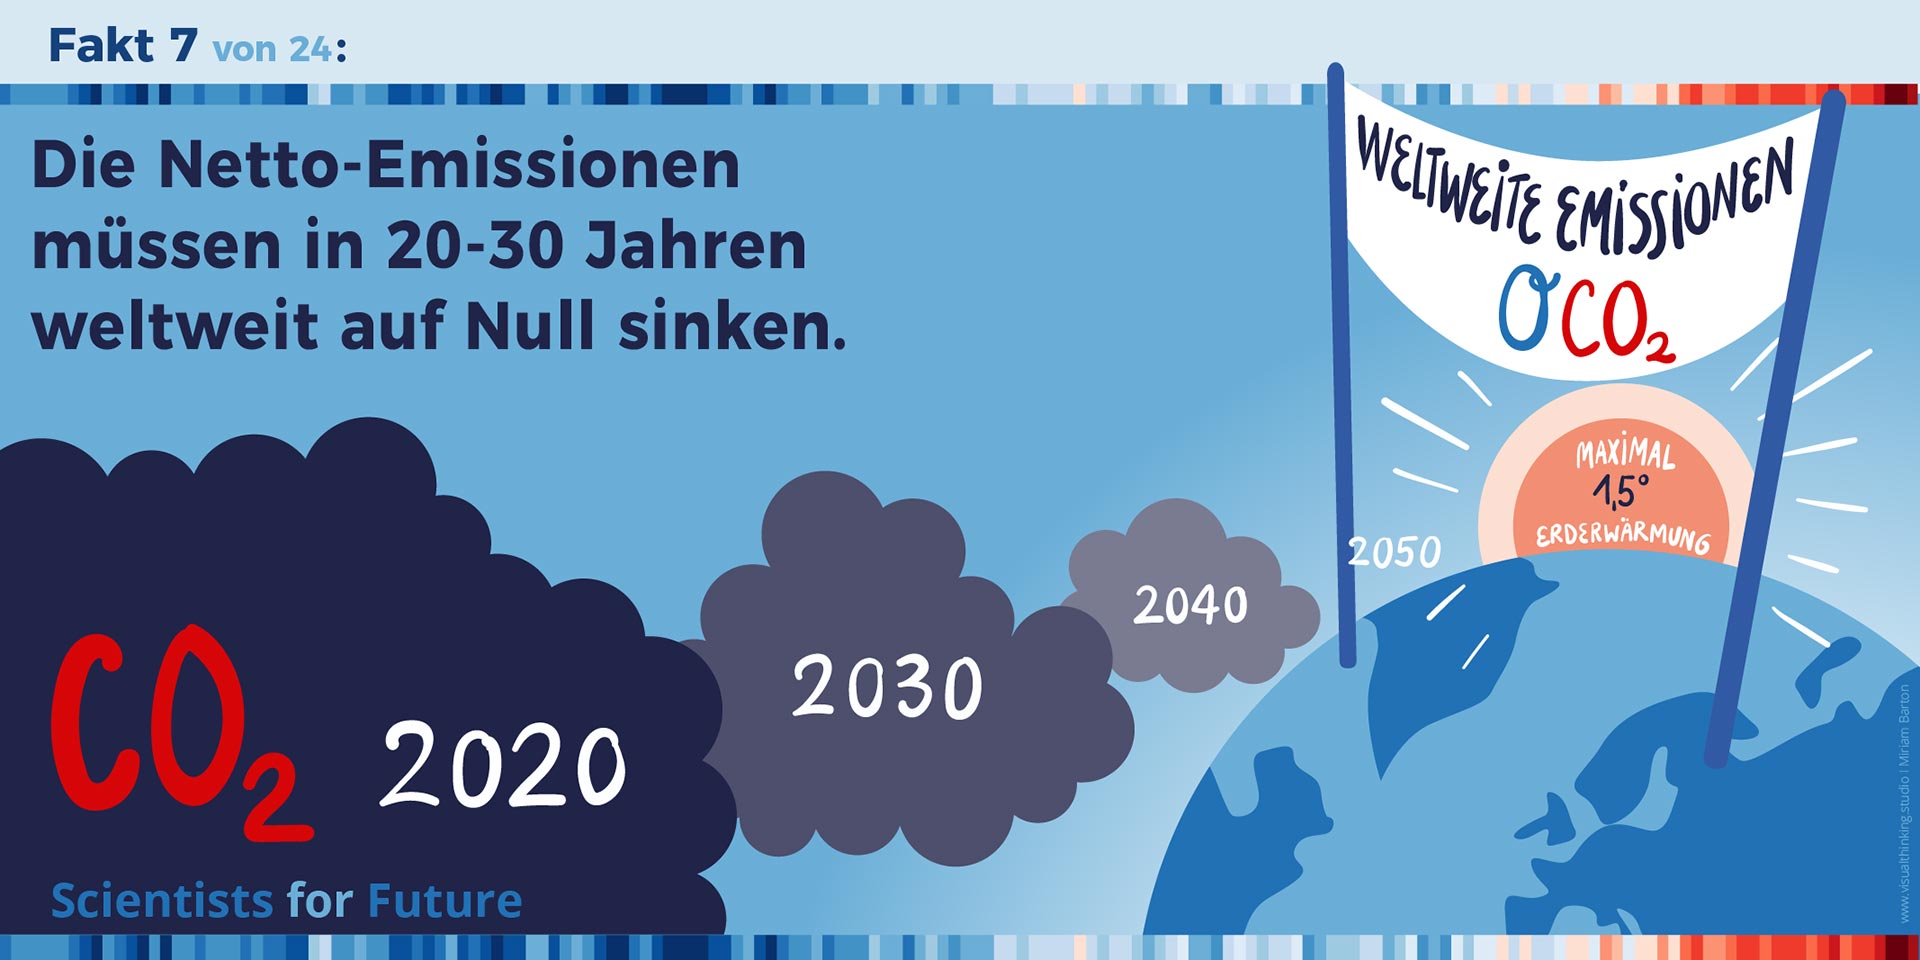
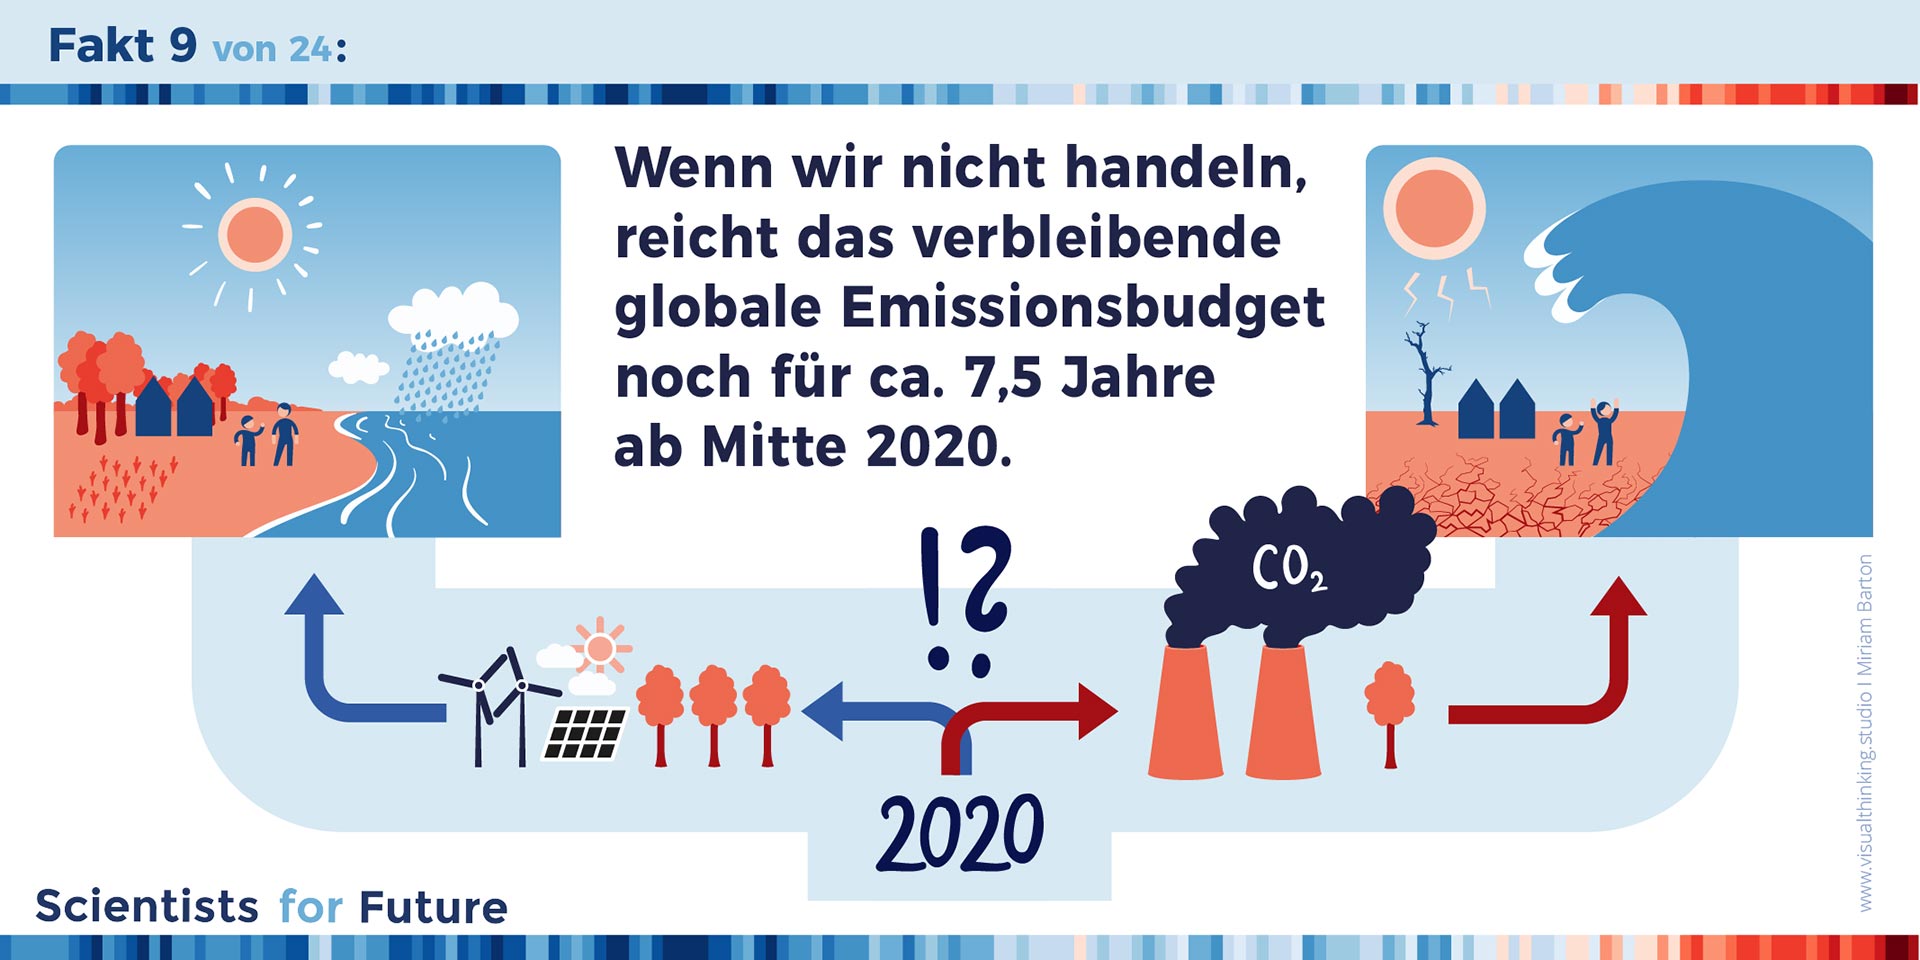
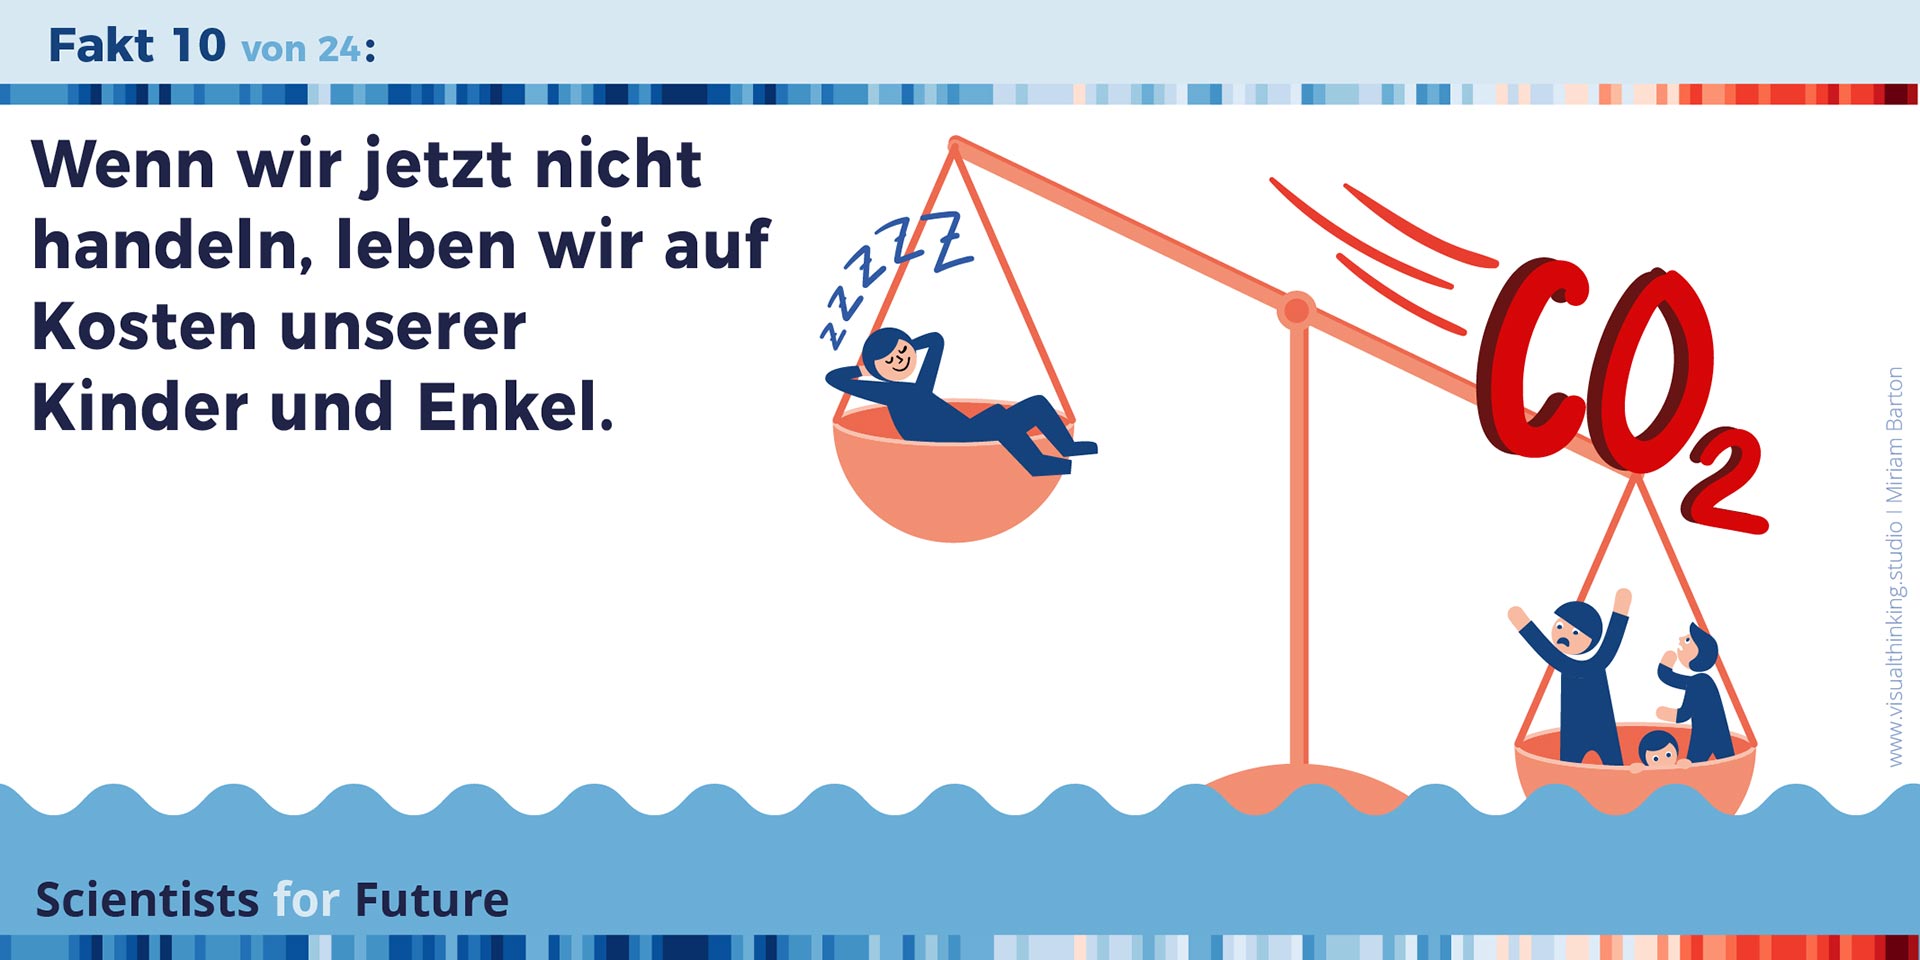
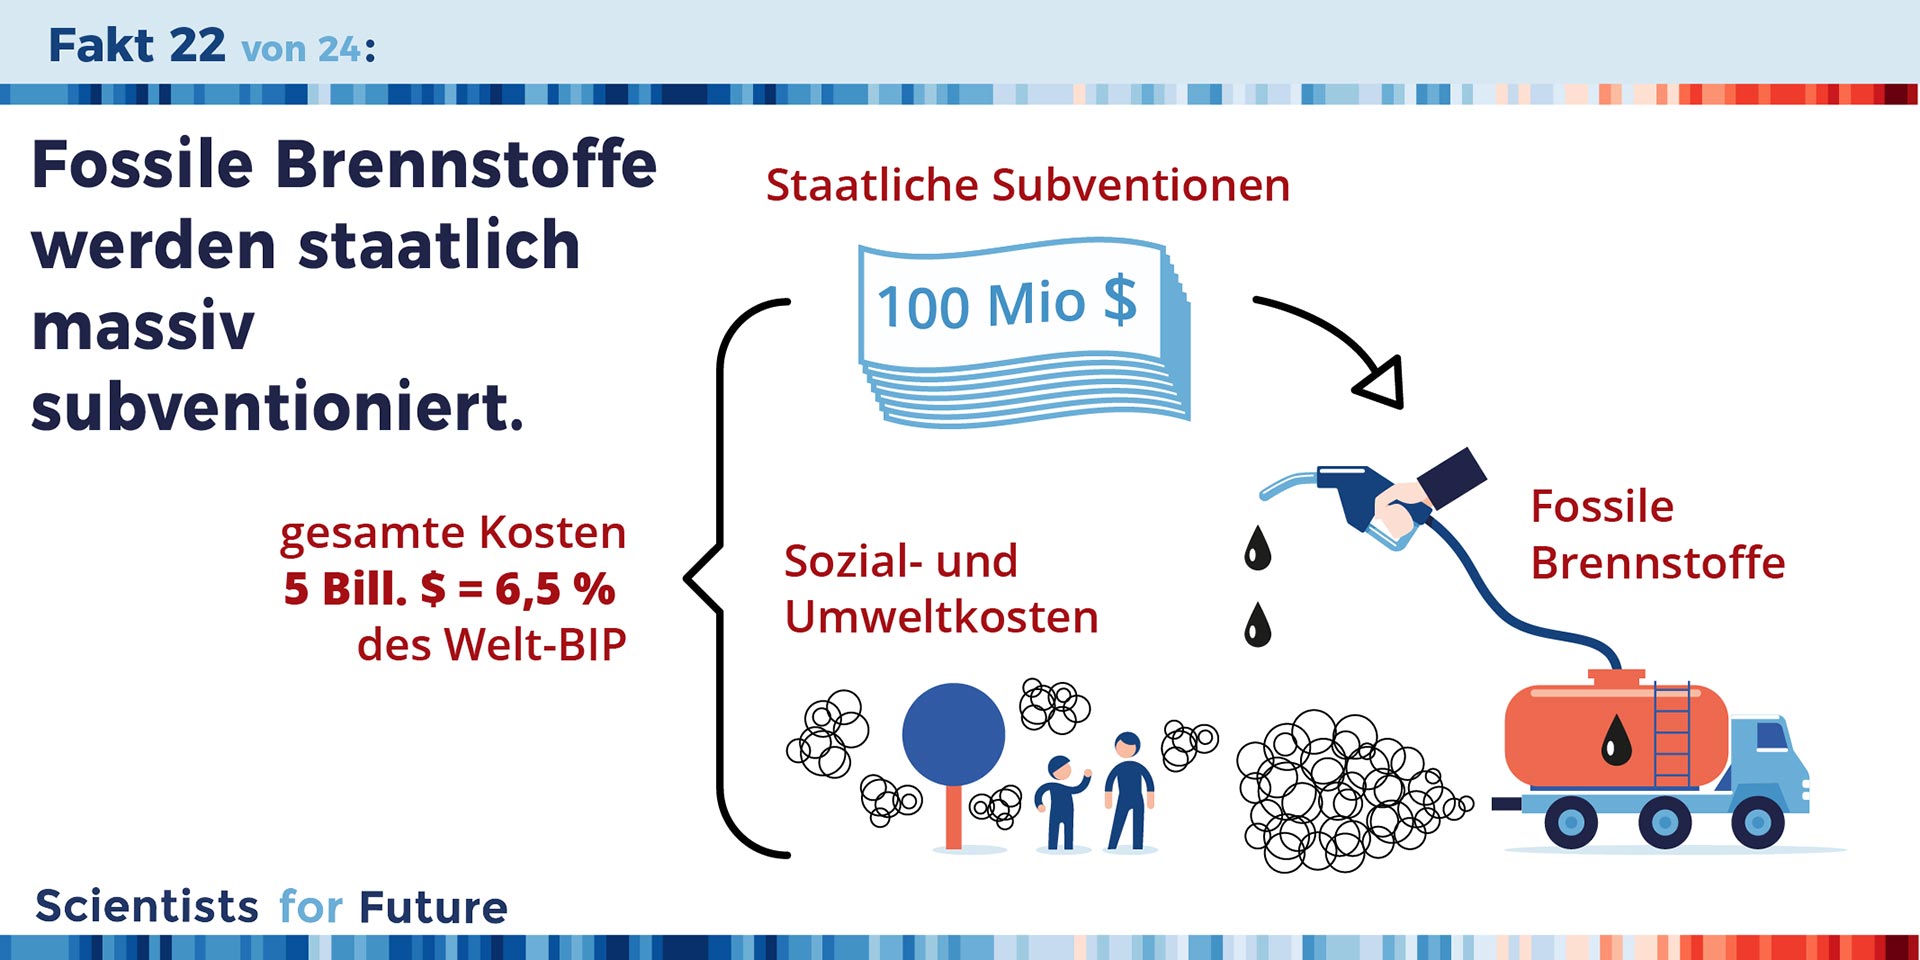
Facts about Climate Change
These info-illustrations were created for Scientists4Future for use on social media as part of a pro-bono campaign by Visuals4FutureVisuals4Future. Eight of the share-pics were designed by Miriam Barton. They were realized in 3 formats each as posters, for Twitter, and Instagram.
SBB
Infographics for the SBB
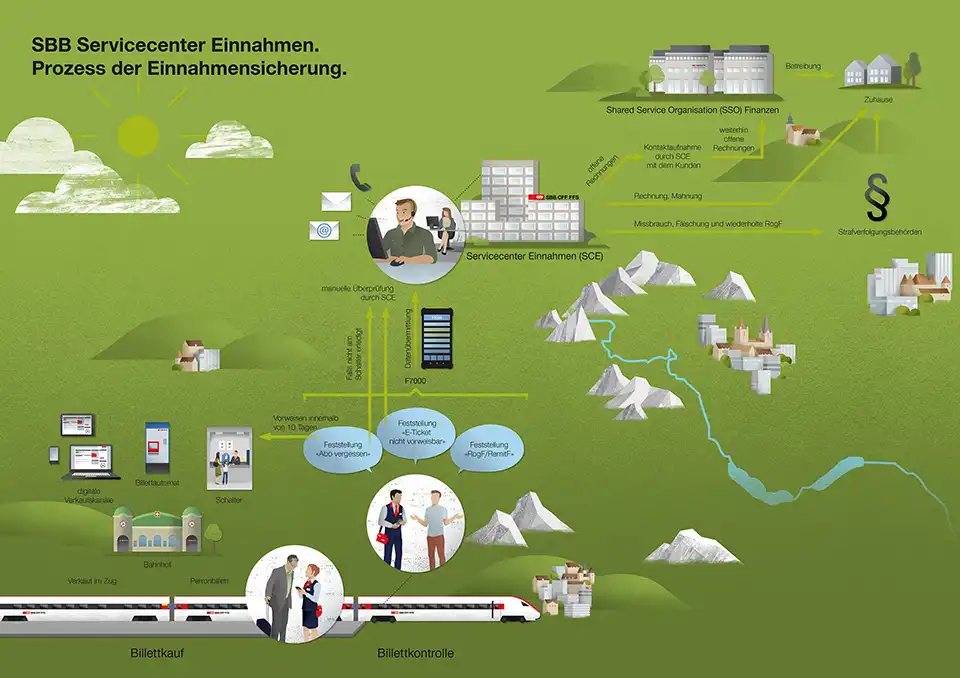
This example visualizes the formal process of ticket control for the Swiss Federal Railways (SBB). The procedure is broken down in a friendly and clear manner in the SBB’s corporate style.

Life Science Nord Magazin
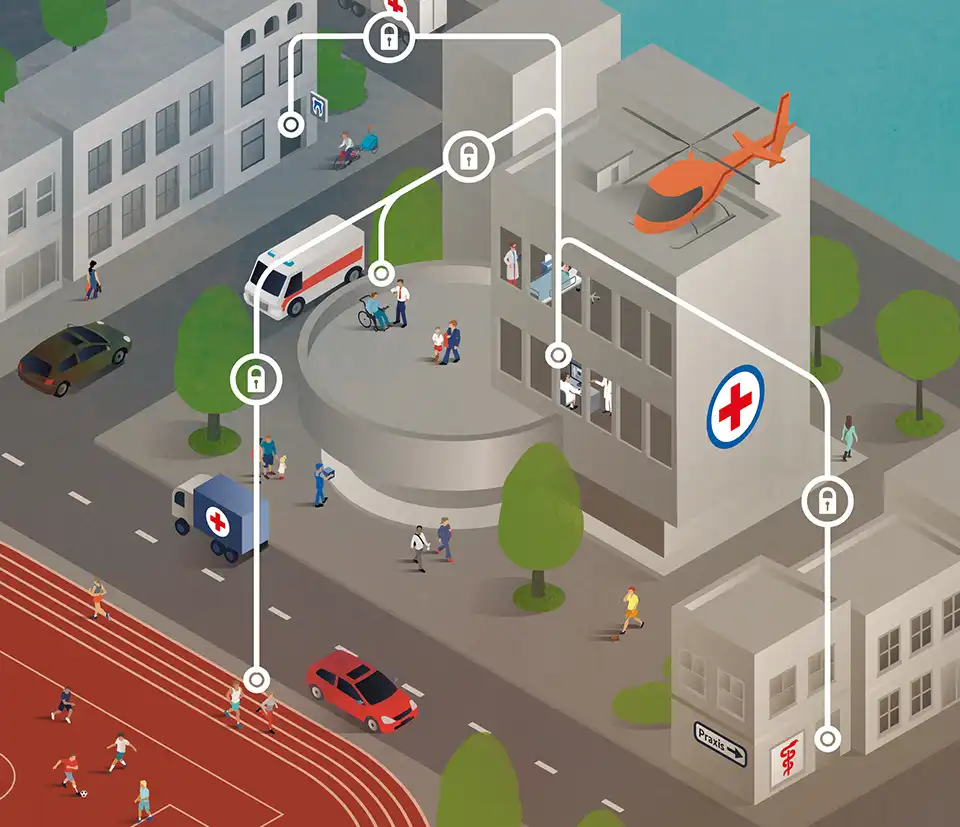
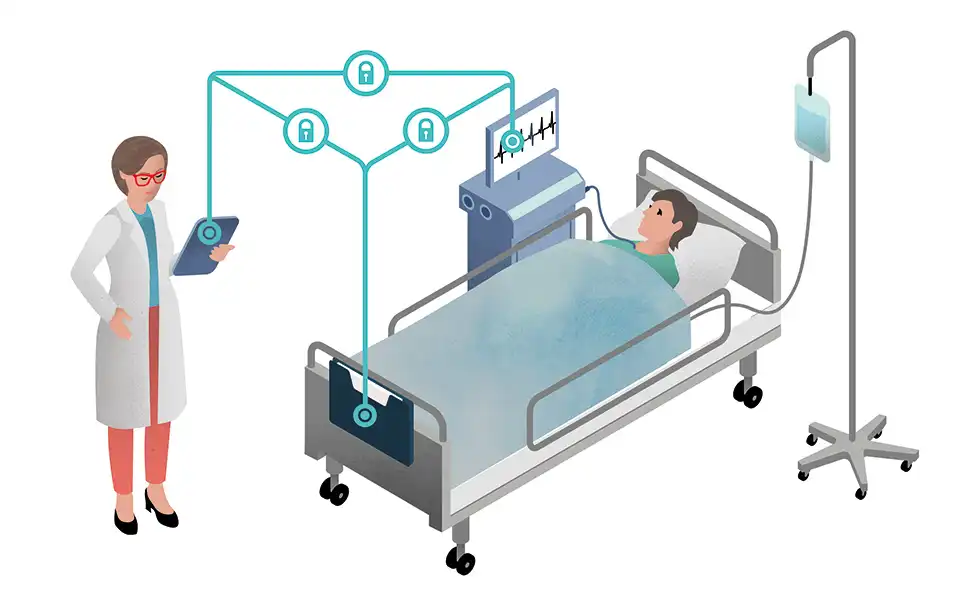
Secure Data Streams
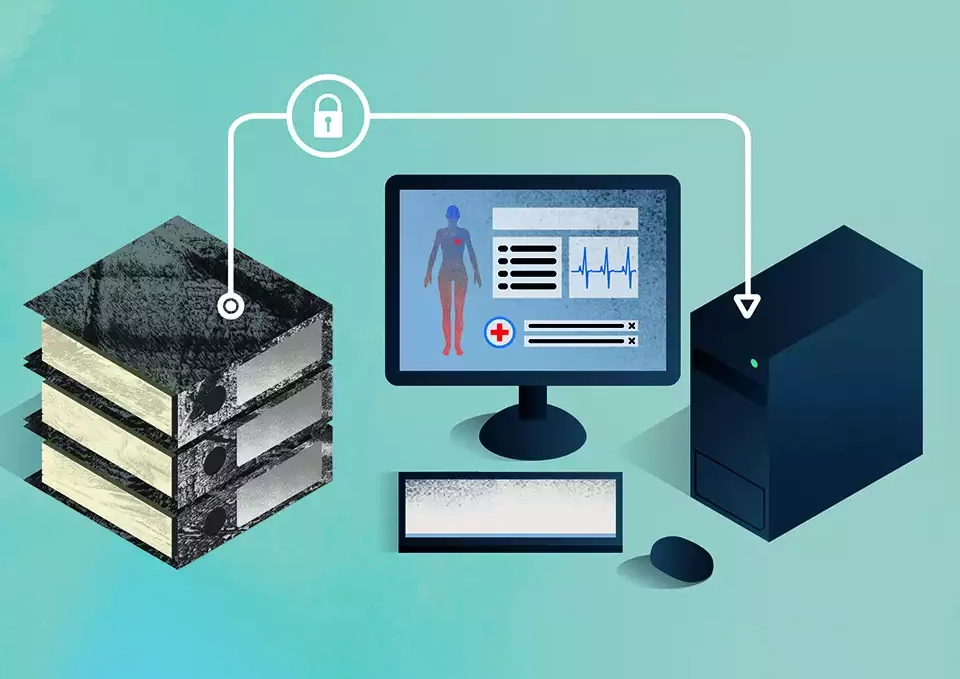
These infographics were created for the Life Science Nord Magazins on the topic „Secure Data Streams – How actors in the healthcare sector want to shape data protection“.
Infographics explain in a playful and understandable way the connections of data, numbers and facts.
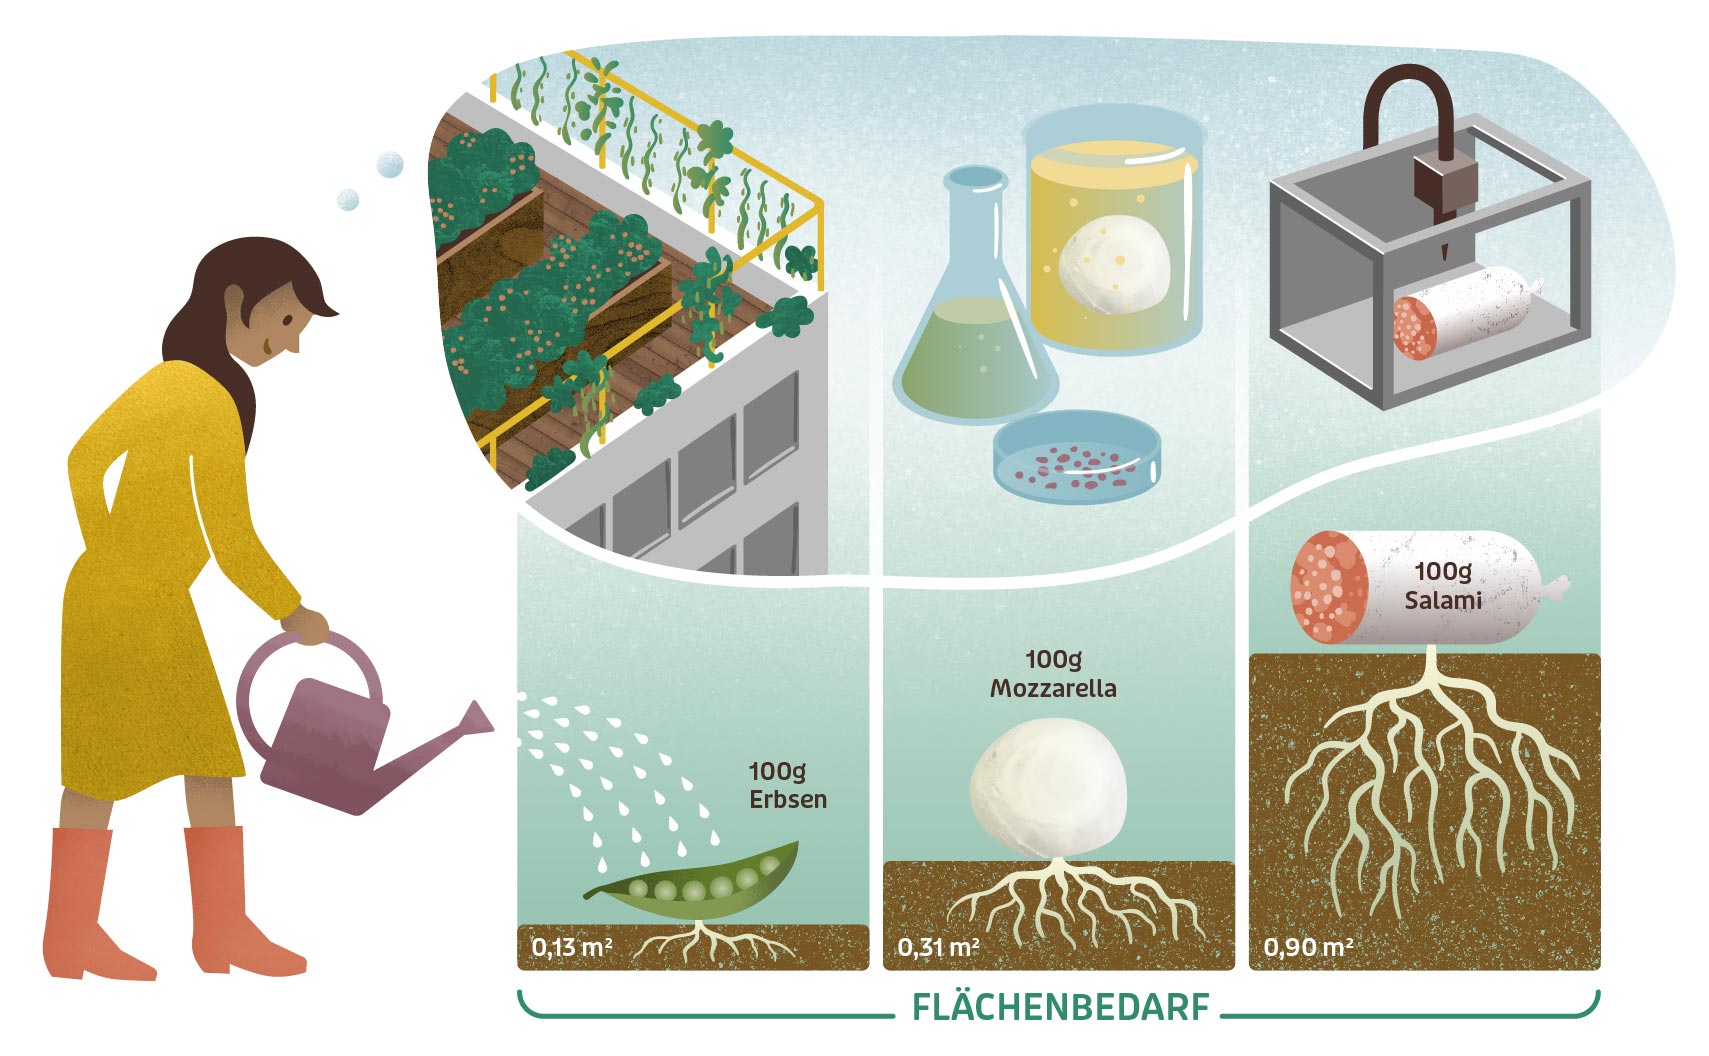

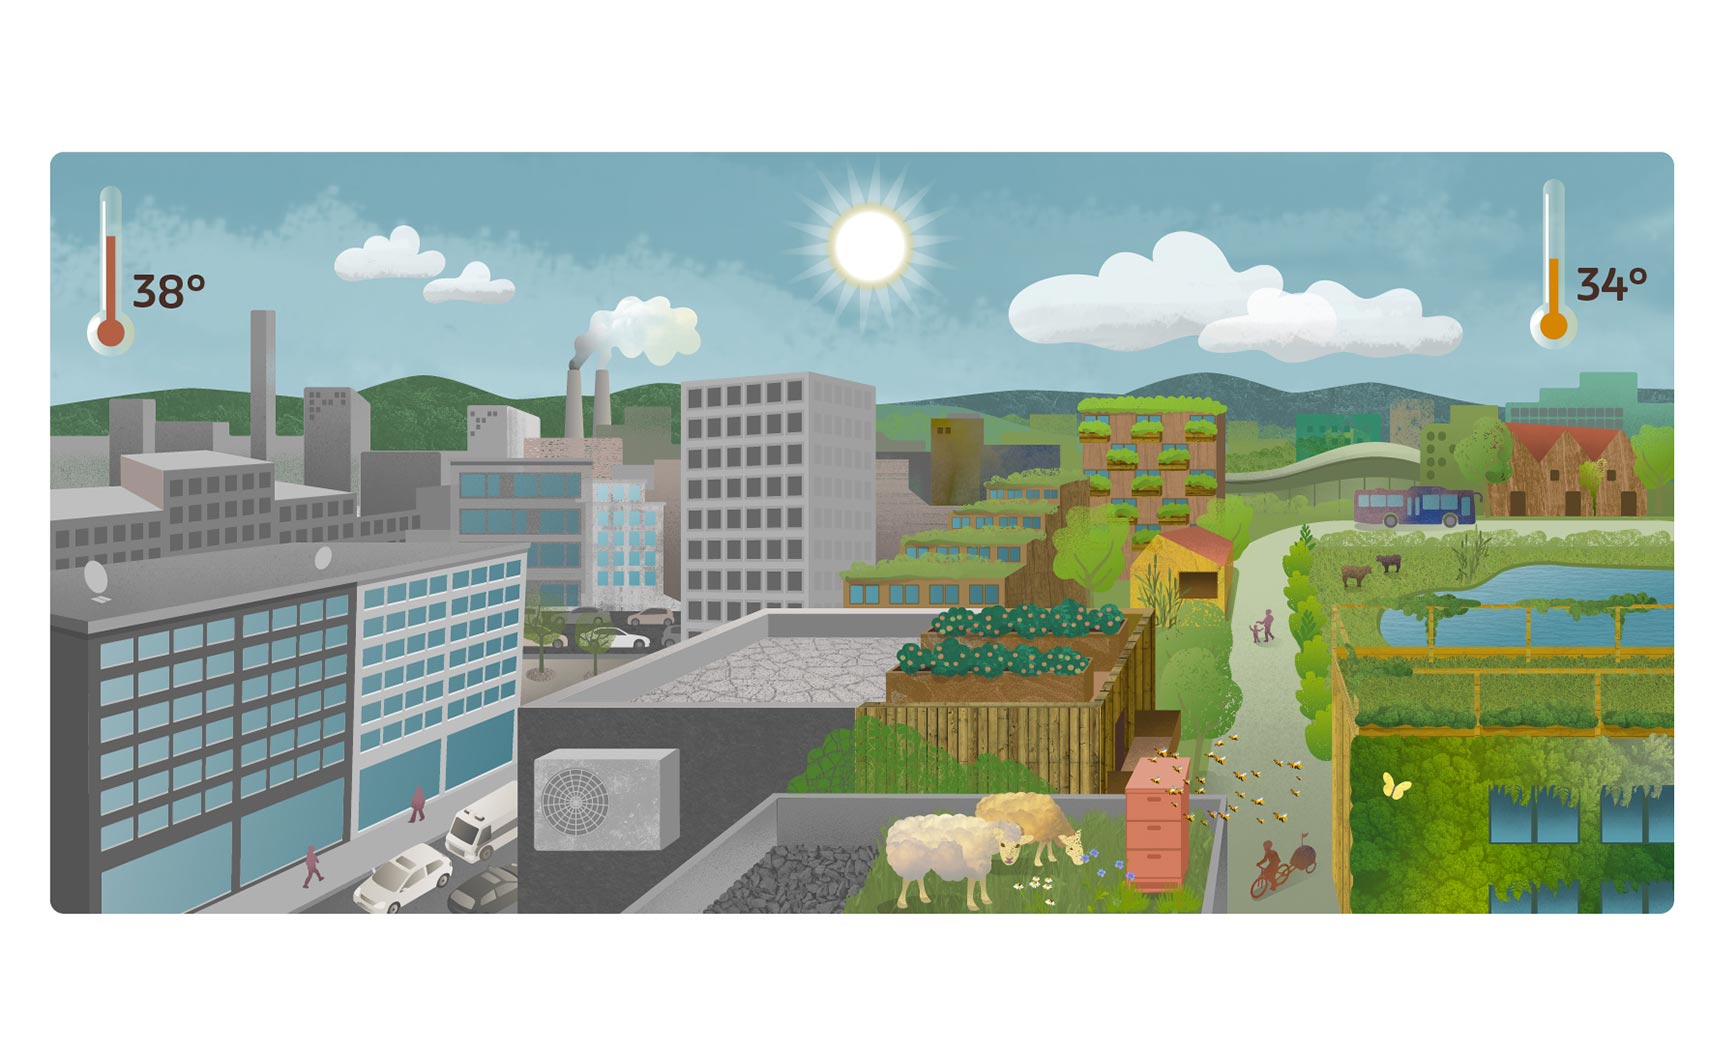
#NaturFutur
Information panels
Convinced? Then contact us.
Say Hello!
Convinced? Then contact us. We will be happy to advise you and find the right way to communicate your content effectively and efficiently. Whether it’s an animated explainer video, infographic or scientific data visualization, we can help. Contact us at . You can reach us by phone from Monday to Friday at +49 30 5463 2812. In urgent cases, you can also reach us at +49 176 3286 4431.
Offer
Graphic
Isometric
Flat Style
Realistic film
White Board
Pixel Art
Hand made
FORMATS
Explainer movies
E-Learning
Image film
Product video
Recruiting video
Commercials
Social media video
App video
Trade film
Internal communication